AutoCorrelation
Contents
AutoCorrelation
This notebook examines auto-correlation measures applied to simulated neural time series.
This notebook covers:
autocorrelation
autocorrelation decay time
# Setup notebook state
from nbutils import setup_notebook; setup_notebook()
import numpy as np
import matplotlib.pyplot as plt
from neurodsp.aperiodic import compute_autocorr
from neurodsp.sim import sim_powerlaw, sim_combined, sim_synaptic_current, sim_knee
from neurodsp.utils import set_random_seed
# Import custom project code
from apm.io import APMDB
from apm.run import run_sims, run_sims_load
from apm.methods import autocorr, autocorr_decay_time
from apm.methods.settings import AC_PARAMS, AC_DECAY_PARAMS
from apm.plts import plot_lines, plot_colorbar
from apm.plts.sims import plot_sims, plot_ap_sims, plot_pe_sims
from apm.plts.utils import truncate_colormap, figsaver
from apm.plts.settings import COLORS
from apm.sim.examples import get_examples
from apm.sim.settings import N_SIMS
from apm.sim.defs import SIM_ITERS
from apm.utils.data import min_n_max
Settings
# Get current sampling rate
fs = SIM_ITERS.fs
# Add sampling rate to settings
AC_DECAY_PARAMS['fs'] = fs
# # Set custom max lag time for autocorrelation
# AC_PARAMS['max_lag'] = 125
# Custom settings for autocorrelation - downsample frequencies and powers
FREQS2 = np.arange(5., 40, 10)
POWERS2 = np.round(np.arange(0, 2.5, 0.5), 1)
# Update values in iterators
SIM_ITERS.update_iter('osc_freq', 'values', FREQS2)
SIM_ITERS.update_iter('osc_pow', 'values', [[1, val] for val in POWERS2])
# Check auto-correlation parameters
print(AC_PARAMS)
print(AC_DECAY_PARAMS)
{'max_lag': 250, 'lag_step': 1}
{'fs': 250, 'max_lag': 1500, 'lag_step': 2, 'level': 0.5}
# Define expected size of the autocorrelation result
OUTSIZE = int(AC_PARAMS['max_lag'] / AC_PARAMS['lag_step'] + 1)
# Set the colormap for the plots
cmap_name = 'BuGn_r'
cmap_range = (0., 0.75)

# Get the requested colormap & range
cmap = truncate_colormap(plt.get_cmap(cmap_name), *cmap_range)

# Set up the colors for plotting
exp_colors = cmap(np.linspace(0., 1.0, len(SIM_ITERS['ap_exp'].values)))
freq_colors = cmap(np.linspace(0., 1.0, len(FREQS2)))
power_colors = cmap(np.linspace(0., 1.0, len(POWERS2)))
# Plot settings
PLT_KWARGS = {
    'xlabel' : 'Time (s)',
    'ylabel' : 'Autocorrelation',
}
# Settings for saving figures
SAVE_FIG = True
FIGPATH = APMDB().figs_path / '21_autocorr'

# Create helper function to manage figsaver settings
fsaver = figsaver(SAVE_FIG, FIGPATH)
# Set the random seed
set_random_seed(111)
# Define collection of example signals
examples = get_examples()
AutoCorrelation Measures
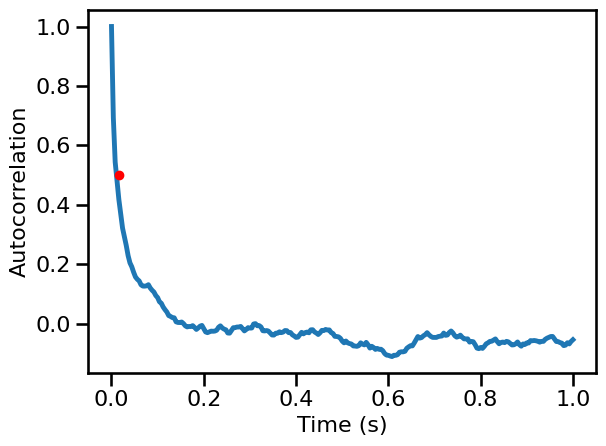
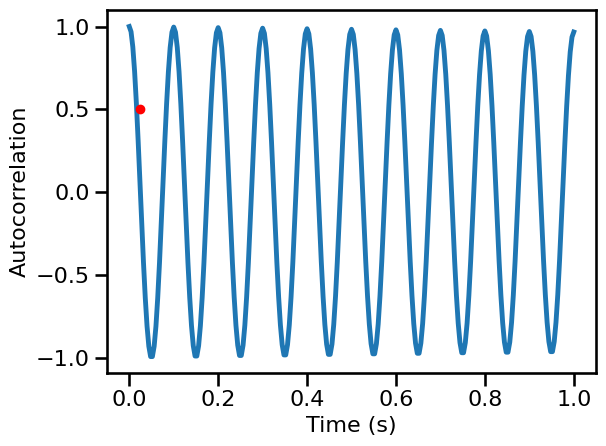
The autocorrelation of a signal is measured as the correlation between a signal, and a time-lagged copy of itself. This is typically computed a range of different time lags.
The autocorrelation decay time is a measure of how quickly the autocorrelation decays to a given value - for example, at what timelag the autocorrelation first crosses below zero.
Measures on Example Signals
First, we will calculate the autocorrelation across different example signals.
Powerlaw Signals
# Calculate autocorrelation
times, sig_ap_ac = compute_autocorr(examples['powerlaw'], **AC_PARAMS)
# Compute decay rate time
ap_decay = autocorr_decay_time(examples['powerlaw'], **AC_DECAY_PARAMS)
ap_decay
0.016
# Plot the autocorrelation across time delays
plot_lines(times / fs, sig_ap_ac, **PLT_KWARGS, **fsaver('ac_ap'))
plt.gca().plot(ap_decay, AC_DECAY_PARAMS['level'], '.', ms=12, color='red')
[<matplotlib.lines.Line2D at 0x7f7ef6e7a8b0>]
Oscillatory Signal
# Calculate autocorrelation
times, sig_osc_ac = compute_autocorr(examples['oscillation'], **AC_PARAMS)
# Compute decay rate time
osc_decay = autocorr_decay_time(examples['oscillation'], **AC_DECAY_PARAMS)
osc_decay
0.024
# Plot the autocorrelation across time delays
plot_lines(times / fs, sig_osc_ac, **PLT_KWARGS, **fsaver('ac_osc'))
plt.gca().plot(osc_decay, AC_DECAY_PARAMS['level'], '.', ms=12, color='red')
[<matplotlib.lines.Line2D at 0x7f7eda244370>]
Combined Signal
# Calculate autocorrelation
times, sig_comb_ac = compute_autocorr(examples['combined'], **AC_PARAMS)
# Compute decay rate time
comb_decay = autocorr_decay_time(examples['combined'], **AC_DECAY_PARAMS)
comb_decay
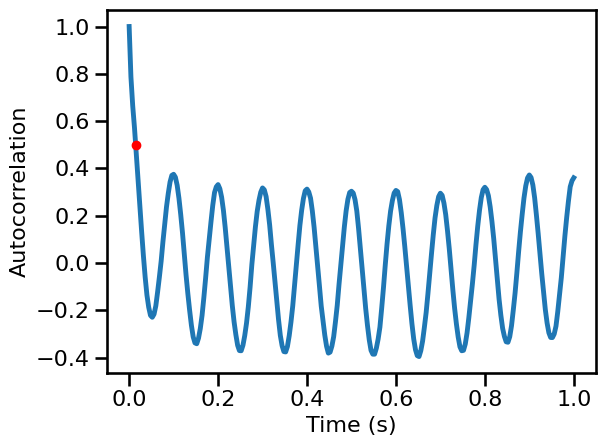
0.016
# Plot the autocorrelation across time delays
plot_lines(times / fs, sig_comb_ac, **PLT_KWARGS, **fsaver('ac_comb'))
plt.gca().plot(comb_decay, AC_DECAY_PARAMS['level'], '.', ms=12, color='red')
[<matplotlib.lines.Line2D at 0x7f7eda52f6a0>]
Synaptic Activity Model
# Calculate autocorrelation
times, sig_syn_ac = compute_autocorr(examples['synaptic'], **AC_PARAMS)
# Compute decay rate time
syn_decay = autocorr_decay_time(examples['synaptic'], **AC_DECAY_PARAMS)
syn_decay
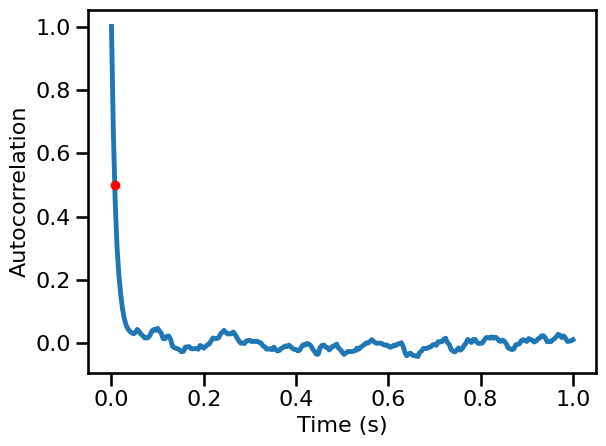
0.008
# Plot the autocorrelation across time delays
plot_lines(times / fs, sig_syn_ac, **PLT_KWARGS, **fsaver('ac_syn'))
plt.gca().plot(syn_decay, AC_DECAY_PARAMS['level'], '.', ms=12, color='red')
[<matplotlib.lines.Line2D at 0x7f7eda800a30>]
Powerlaw Signals with a Knee
# Calculate autocorrelation
times, sig_kn_ac = compute_autocorr(examples['knee'], **AC_PARAMS)
# Compute decay rate time
kn_decay = autocorr_decay_time(examples['knee'], **AC_DECAY_PARAMS)
kn_decay
0.016
# Plot the autocorrelation across time delays
plot_lines(times / fs, sig_kn_ac, **PLT_KWARGS, **fsaver('ac_knee'))
plt.gca().plot(kn_decay, AC_DECAY_PARAMS['level'], '.', ms=12, color='red')
[<matplotlib.lines.Line2D at 0x7f7eda827ee0>]
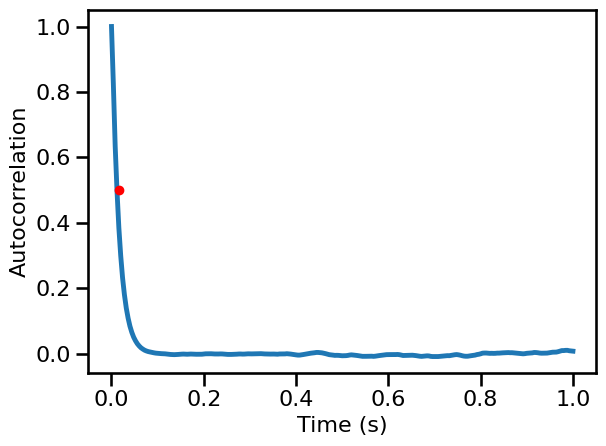
Bandwidth
# Calculate autocorrelation
times, sig_bw_ac = compute_autocorr(examples['comb_peak'], **AC_PARAMS)
# Compute decay rate time
bw_decay = autocorr_decay_time(examples['comb_peak'], **AC_DECAY_PARAMS)
bw_decay
0.016
# Plot the autocorrelation across time delays
plot_lines(times / fs, sig_bw_ac, **PLT_KWARGS, **fsaver('ac_bw'))
plt.gca().plot(bw_decay, AC_DECAY_PARAMS['level'], '.', ms=12, color='red')
[<matplotlib.lines.Line2D at 0x7f7edab4c460>]
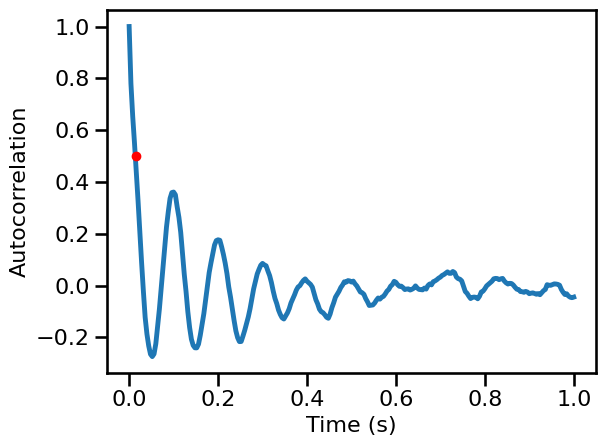
Burst
# Calculate autocorrelation
times, sig_burst_ac = compute_autocorr(examples['comb_burst'], **AC_PARAMS)
# Compute decay rate time
burst_decay = autocorr_decay_time(examples['comb_burst'], **AC_DECAY_PARAMS)
burst_decay
0.016
# Plot the autocorrelation across time delays
plot_lines(times / fs, sig_burst_ac, **PLT_KWARGS, **fsaver('ac_burst'))
plt.gca().plot(burst_decay, AC_DECAY_PARAMS['level'], '.', ms=12, color='red')
[<matplotlib.lines.Line2D at 0x7f7edacfe2e0>]
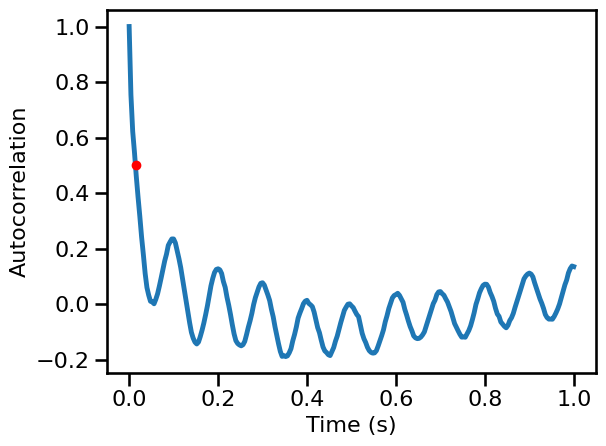
AutoCorrelation Simulations: Aperiodic Variations
Powerlaw Signals
# Run a set of simulations, calculating autocorrelation across exponents
ac_sims_exp = run_sims(sim_powerlaw, SIM_ITERS['ap_exp'],
                       autocorr, AC_PARAMS, N_SIMS, outsize=OUTSIZE)
# Plot autocorrelation across exponent values
for ac, color in zip(np.mean(ac_sims_exp, 1), exp_colors):
    plot_lines(times / fs, ac, color=color, lw=3)
plot_lines(**PLT_KWARGS, **fsaver('ac_exp'))
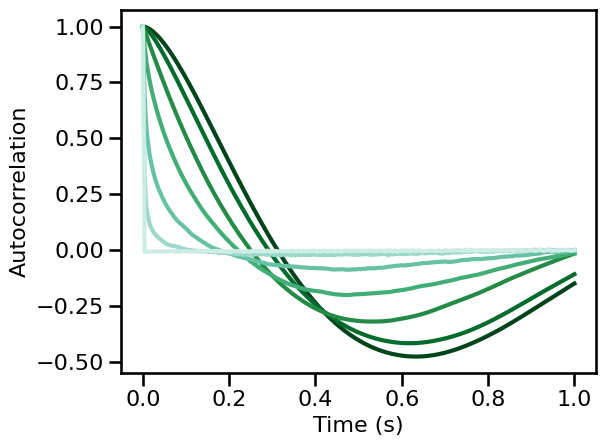
# Run a set of simulations, calculating autocorrelation across exponents
decay_sims_exp = run_sims(sim_powerlaw, SIM_ITERS['ap_exp'],
                          autocorr_decay_time, AC_DECAY_PARAMS, N_SIMS)
Combined Signals
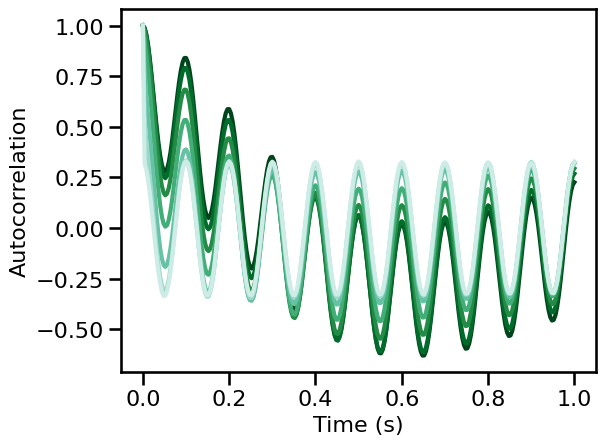
# Run a set of simulations, calculating autocorrelation across exponents, with an oscillation
ac_sims_comb = run_sims(sim_combined, SIM_ITERS['comb_exp'],
                        autocorr, AC_PARAMS, N_SIMS, outsize=OUTSIZE)
# Plot autocorrelation across exponent values
for ac, color in zip(np.mean(ac_sims_comb, 1), exp_colors):
    plot_lines(times / fs, ac, color=color, lw=3)
plot_lines(**PLT_KWARGS, **fsaver('ac_comb'))
# Run a set of simulations, calculating autocorrelation across exponents
decay_sims_comb = run_sims(sim_combined, SIM_ITERS['comb_exp'],
                           autocorr_decay_time, AC_DECAY_PARAMS, N_SIMS)
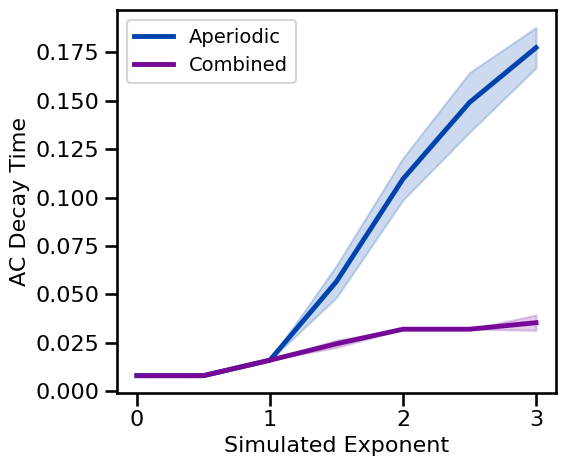
# Plot AC decay rate estimates across aperiodic variations
plot_ap_sims(decay_sims_exp, decay_sims_comb, 'AC Decay Time', **fsaver('ac_decay_ap'))
AutoCorrelation Simulations: Periodic Variations
Oscillation Frequency
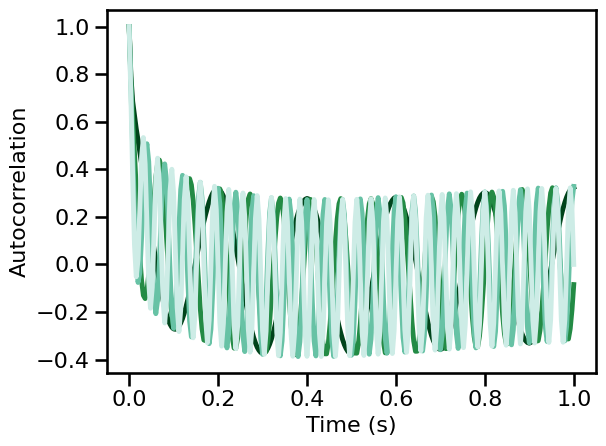
# Run a set of simulations, calculating autocorrelations across oscillation frequency
ac_sims_freq = run_sims(sim_combined, SIM_ITERS['osc_freq'],
                        autocorr, AC_PARAMS, N_SIMS, outsize=OUTSIZE)
# Plot autocorrelation across oscillation frequency
for ac, color in zip(np.mean(ac_sims_freq, 1), freq_colors):
    plot_lines(times / fs, ac, color=color)
plot_lines(**PLT_KWARGS, **fsaver('ac_osc_freq'))
# Run a set of simulations, calculating autocorrelation across oscillation frequency
decay_sims_freq = run_sims(sim_combined, SIM_ITERS['osc_freq'],
                           autocorr_decay_time, AC_DECAY_PARAMS, N_SIMS)
Oscillation Power
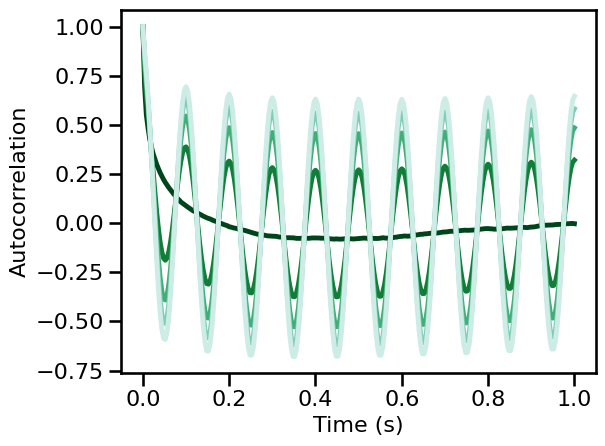
# Run a set of simulations, calculating autocorrelations across oscillation power
ac_sims_pow = run_sims(sim_combined, SIM_ITERS['osc_pow'],
                       autocorr, AC_PARAMS, N_SIMS, outsize=OUTSIZE)
# Plot autocorrelation across oscillation power
for ac, color in zip(np.mean(ac_sims_pow, 1), power_colors):
    plot_lines(times / fs, ac, color=color)
plot_lines(**PLT_KWARGS, **fsaver('ac_osc_pow'))
# Run a set of simulations, calculating autocorrelation across oscillation power
decay_sims_pow = run_sims(sim_combined, SIM_ITERS['osc_pow'],
                          autocorr_decay_time, AC_DECAY_PARAMS, N_SIMS)
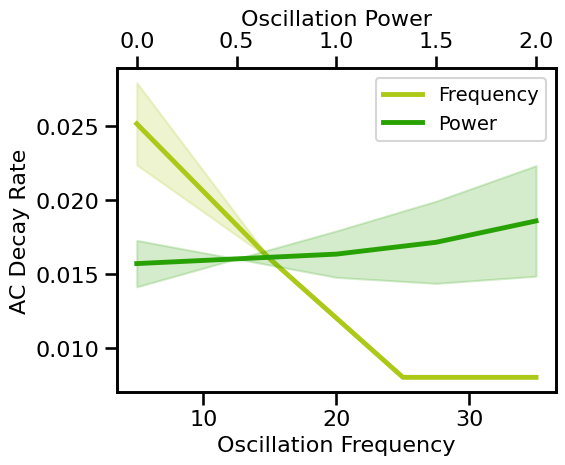
# Plot AC decay rate estimates across periodic variations
plot_pe_sims(decay_sims_freq, decay_sims_pow, 'AC Decay Rate',
             x_freqs=FREQS2, x_pows=POWERS2, **fsaver('ac_decay_pe'))
Simulations: Synaptic Model Time Constants
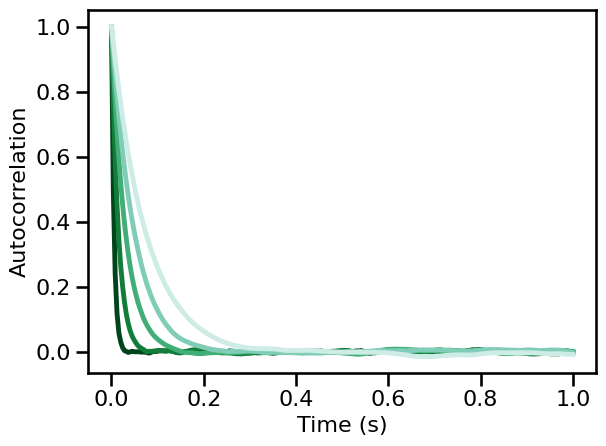
# Run a set of simulations, calculating autocorrelations across synaptic timescales
ac_sims_tscales = run_sims(sim_synaptic_current, SIM_ITERS['syn_tscales'],
                           autocorr, AC_PARAMS, N_SIMS, outsize=OUTSIZE)
# Plot autocorrelation across synaptic timescale values
for ac, color in zip(np.mean(ac_sims_tscales, 1), power_colors):
    plot_lines(times / fs, ac, color=color)
plot_lines(**PLT_KWARGS, **fsaver('ac_osc_tscale'))
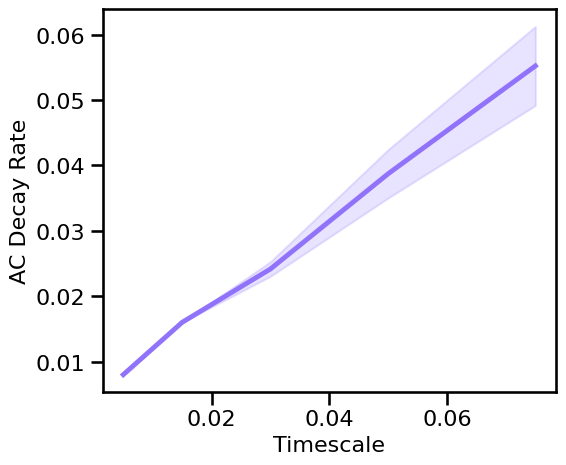
# Run a set of simulations, calculating autocorrelation decay across synaptic timescales
decay_sims_tscales = run_sims(sim_synaptic_current, SIM_ITERS['syn_tscales'],
                              autocorr_decay_time, AC_DECAY_PARAMS, N_SIMS)
# Plot the estimated AC decay rate across different timescales
plot_sims(SIM_ITERS['syn_tscales'].values, decay_sims_tscales, 'Timescale',
          'AC Decay Rate', COLORS['KN'], **fsaver('ac_decay_tscale'))
Simulations: Knee Variations
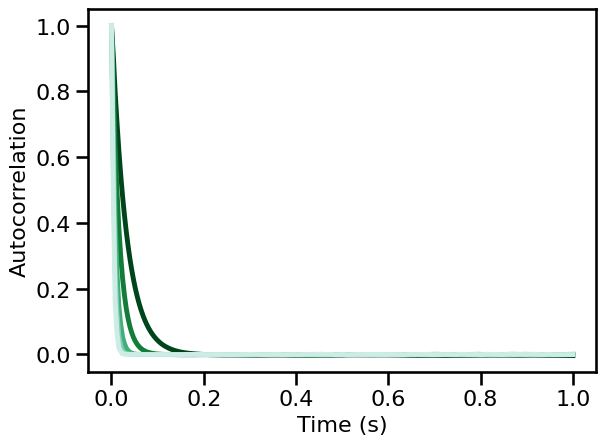
# Run a set of simulations, calculating autocorrelations across knee values
ac_sims_knee = run_sims(sim_knee, SIM_ITERS['kn_knee'],
                        autocorr, AC_PARAMS, N_SIMS, outsize=OUTSIZE)
# Plot autocorrelation across knee values
for ac, color in zip(np.mean(ac_sims_knee, 1), power_colors):
    plot_lines(times / fs, ac, color=color)
plot_lines(**PLT_KWARGS, **fsaver('ac_osc_kn'))
# Run a set of simulations, calculating autocorrelation decay across knee values
decay_sims_knee = run_sims(sim_knee, SIM_ITERS['kn_knee'],
                           autocorr_decay_time, AC_DECAY_PARAMS, N_SIMS)
# Plot the estimated AC decay rate across different knee values
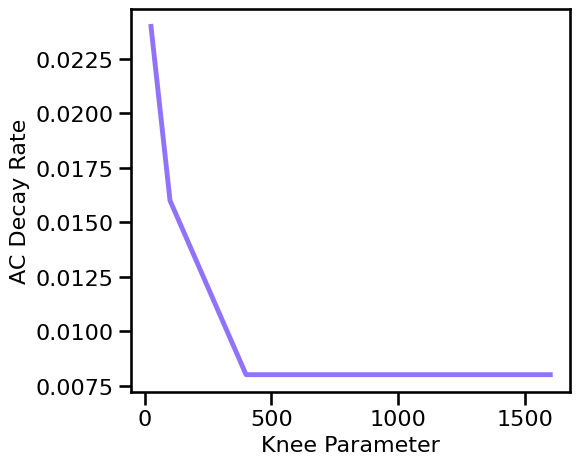
plot_sims(SIM_ITERS.iters['kn_knee'].values, decay_sims_knee,
          'Knee Parameter', 'AC Decay Rate', COLORS['KN'], **fsaver('ac_decay_kn'))
Simulations: Bandwidth Variations
# Run a set of simulations, calculating autocorrelation across peak bandwidth (sims from file)
ac_sims_bw = run_sims_load('comb-bw-' + str(fs), autocorr, AC_PARAMS, outsize=OUTSIZE)
# Plot autocorrelation across oscillation bandwidth
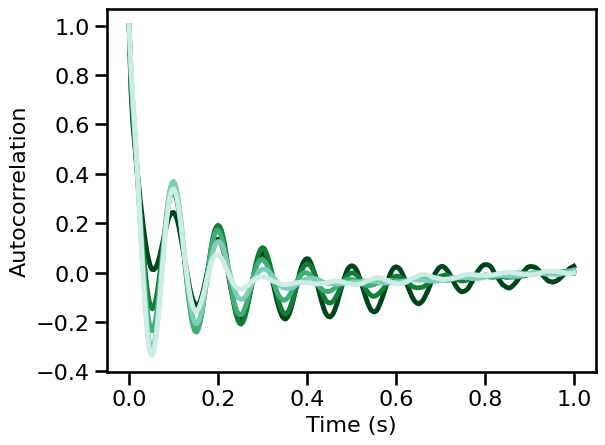
for ac, color in zip(np.mean(ac_sims_bw, 1), power_colors):
    plot_lines(times / fs, ac, color=color)
plot_lines(**PLT_KWARGS, **fsaver('ac_osc_bw'))
# Run a set of simulations, calculating AC decay rate across peak bandwidths
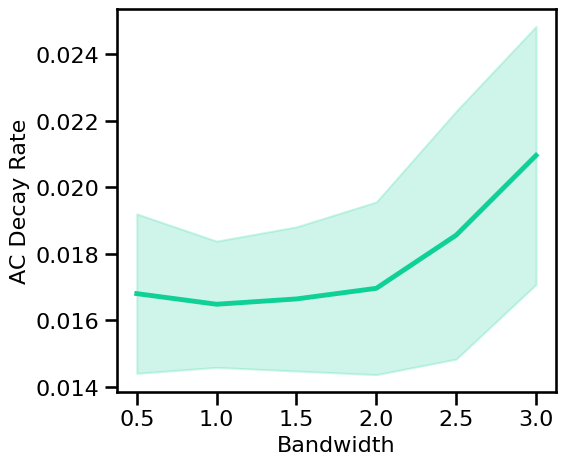
decay_sims_bw = run_sims_load('comb-bw-' + str(fs), autocorr_decay_time, AC_DECAY_PARAMS)
# Plot the estimated AC decay across peak bandwidth
plot_sims(SIM_ITERS['peak_bw'].values, decay_sims_bw, 'Bandwidth',
          'AC Decay Rate', COLORS['BW'], **fsaver('ac_decay_bw'))
Simulations: Burst Probability
# Run a set of simulations, calculating autocorrelation across burst probability
ac_sims_burst = run_sims(sim_combined, SIM_ITERS['comb_burst'],
                         autocorr, AC_PARAMS, N_SIMS, outsize=OUTSIZE)
# Plot autocorrelation across oscillation burst probability
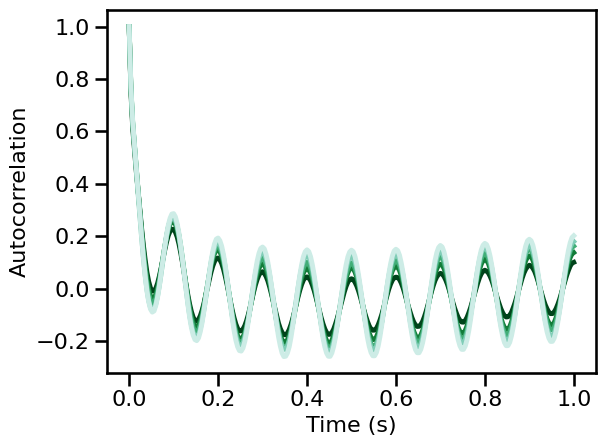
for ac, color in zip(np.mean(ac_sims_burst, 1), power_colors):
    plot_lines(times / fs, ac, color=color)
plot_lines(**PLT_KWARGS, **fsaver('ac_osc_burst'))
# Run a set of simulations, calculating autocorrelation decay across knee values
decay_sims_burst = run_sims(sim_combined, SIM_ITERS['comb_burst'],
                            autocorr_decay_time, AC_DECAY_PARAMS, N_SIMS)
# Plot the estimated AC decay across peak bandwidth
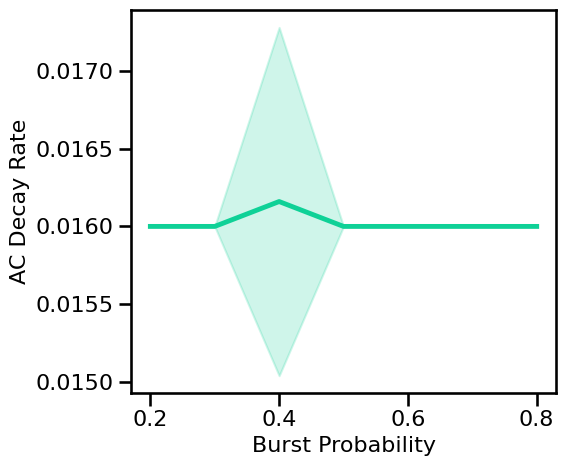
plot_sims(SIM_ITERS['comb_burst'].values, decay_sims_burst, 'Burst Probability',
          'AC Decay Rate', COLORS['BW'], **fsaver('ac_decay_bw'))
Create colorbars for the plots
# Make colorbars for the plots
plot_colorbar(cmap.reversed(), *min_n_max(SIM_ITERS['ap_exp'].values),
              'exponent', close=True, **fsaver('cbar_ac_exp'))
plot_colorbar(cmap.reversed(), *min_n_max(SIM_ITERS['osc_freq'].values),
              'frequency', close=True, **fsaver('cbar_ac_freq'))
plot_colorbar(cmap.reversed(), *min_n_max(POWERS2), 'power',
              close=True, **fsaver('cbar_ac_pow'))
plot_colorbar(cmap.reversed(), *min_n_max(SIM_ITERS['syn_tscales'].values),
              'timescales', close=True, **fsaver('cbar_ac_tscale'))
plot_colorbar(cmap.reversed(), *min_n_max(SIM_ITERS['kn_knee'].values),
              'knee', close=True, **fsaver('cbar_ac_knee'))
plot_colorbar(cmap.reversed(), *min_n_max(SIM_ITERS['peak_bw'].values),
              'bw', close=True, **fsaver('cbar_ac_bw'))
plot_colorbar(cmap.reversed(), *min_n_max(SIM_ITERS['comb_burst'].values),
              'burst probability', close=True, **fsaver('cbar_ac_burst'))
Conclusions
Overall, we can see the following patterns in these simulations:
Autocorrelation:
The autocorrelation of 1/f signals decreases across increasing time lags
The quickness of this decay relates to the 1/f exponent
The autocorrelation of periodic signals is itself rhythmic
The frequency and scale of the autocorrelation relates to oscillatory frequency and power respectively
The autocorrelation of combined signals exhibits with decreasing + rhythmic properties of each component