iEEG Data
Contents
iEEG Data
Analyze iEEG data.
Dataset Details
Words, words, words.
import os
from pathlib import Path

import numpy as np
import matplotlib.pyplot as plt
from scipy.stats import spearmanr, pearsonr

from mne.io import read_raw_edf
from antropy import app_entropy
from antropy import lziv_complexity

from fooof import FOOOF
from neurodsp.spectral import compute_spectrum
from neurodsp.plts import plot_time_series, plot_power_spectra

from bootstrap import bootstrap_corr
# Import custom code
import sys
sys.path.append(str(Path('..').resolve()))

from apm.plts import plot_dots
from apm.utils import format_corr
from apm.methods import specparam, irasa, dfa, hurst, hjorth_complexity, lempelziv
Settings
# Define the data folder
folder = Path('/Users/tom/Documents/Data/External/iEEG/MNI/Wakefulness_AllRegions/')
# Define corr function to use
corr = spearmanr
# Define data information
fs = 200
Load Data
Notes:
time range issue: values beyond 60s
# Get the list of available files
files = os.listdir(folder)
# Check the number of files
n_files = len(files)
print('Number of files: {}'.format(n_files))
Number of files: 38
# Set an example file to load
file = files[14]
file
'Postcentral gyrus (including medial segment)_W.edf'
# Load data file
edf = read_raw_edf(folder / file, verbose=False)
# Extract times series from data object
times = edf.times
data = edf.get_data()
# Restrict data to times of interest
mask = times < 60
data = data[:, mask]
times = times[mask]
# Check data shape
n_chs, n_times = data.shape
n_chs, n_times
(64, 12000)
# Load all data files
all_data = []
for file in files:

    edf = read_raw_edf(folder / file, verbose=False)

    data = edf.get_data()
    data = data[:, edf.times < 60]

    all_data.append(data)

all_data = np.vstack(all_data)
# Check the number of channels
n_chans = all_data.shape[0]
print('Number of channels: {}'.format(n_chans))
Number of channels: 1772
Data Checks
ind = 0
# Plot an example time series (full time)
plot_time_series(times, data[ind, :])

# Plot a zoomed in segment of a time series
plot_time_series(times, data[ind, :], xlim=[5, 10])

# Compute a power spectrum of an example
freqs, powers = compute_spectrum(data[ind, :], fs, nperseg=2*fs, noverlap=fs)
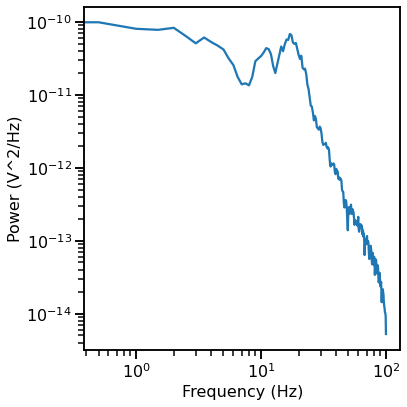
plot_power_spectra(freqs, powers)

Compare Methods
# Settings for spectral parameterization
f_range = [3, 55]
# Initialize specparam model
fm = FOOOF(verbose=False)
# Define measures to apply
measures = {
    specparam : {'fs' : fs, 'f_range' : f_range},
    irasa : {'fs' : fs, 'f_range' : f_range},
    #hurst : {'fs' : fs},
    #dfa : {'fs' : fs},
    lempelziv : {},
    hjorth_complexity : {},
    app_entropy : {}
}
# Compute measures of interest on the data
outputs = run_measures(data, measures)
Compare exponent measures
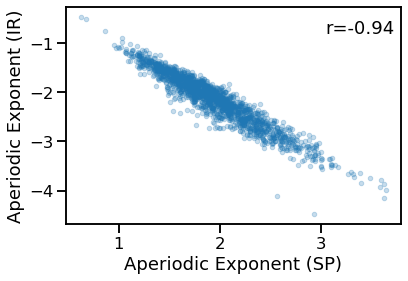
# Compare aperiodic exponent from specparam & IRASA
plot_dots(outputs['specparam'], outputs['irasa'], alpha=0.25,
          xlabel='Aperiodic Exponent (SP)', ylabel='Aperiodic Exponent (IR)')

sp_ir_corrs = bootstrap_corr(outputs['specparam'], outputs['irasa'])
print('  SP & IR:  ', format_corr(*sp_ir_corrs))
SP & IR: r=-0.943 CI[-0.950, -0.936], p=0.000
Compare exponent to other measures
# Comparisons of aperiodic exponent to other measures
_, axes = plt.subplots(1, 3, figsize=(15, 4))
plot_dots(outputs['specparam'], outputs['app_entropy'], alpha=0.25,
          xlabel='Aperiodic Exponent', ylabel='Entropy', ax=axes[0])
plot_dots(outputs['specparam'], outputs['lempelziv'], alpha=0.25,
          xlabel='Aperiodic Exponent', ylabel='LZ Complexity', ax=axes[1])
plot_dots(outputs['specparam'], outputs['hjorth_complexity'], alpha=0.25,
          xlabel='Aperiodic Exponent', ylabel='Hjorth Complexity', ax=axes[2])
plt.subplots_adjust(wspace=0.4)

sp_ent_corrs = bootstrap_corr(outputs['specparam'], outputs['app_entropy'])
print('  EXP & ENT:  ', format_corr(*sp_ent_corrs))
sp_lzc_corrs = bootstrap_corr(outputs['specparam'], outputs['lempelziv'])
print('  EXP & LZC:  ', format_corr(*sp_lzc_corrs))
sp_hcx_corrs = bootstrap_corr(outputs['specparam'], outputs['hjorth_complexity'])
print('  EXP & HCX:  ', format_corr(*sp_hcx_corrs))
  EXP & ENT:   r=-0.886  CI[-0.898, -0.872],  p=0.000
  EXP & LZC:   r=-0.790  CI[-0.810, -0.767],  p=0.000
  EXP & HCX:   r=+0.277  CI[+0.232, +0.320],  p=0.000
Compare entropy to other measures
# Comparisons of entropy to other measures
_, axes = plt.subplots(1, 3, figsize=(15, 4))
plot_dots(outputs['app_entropy'], outputs['specparam'], alpha=0.25,
          xlabel='Entropy', ylabel='Aperiodic Exponent', ax=axes[0])
plot_dots(outputs['app_entropy'], outputs['lempelziv'], alpha=0.25,
          xlabel='Entropy', ylabel='LZ Complexity', ax=axes[1])
plot_dots(outputs['app_entropy'], outputs['hjorth_complexity'], alpha=0.25,
          xlabel='Entropy', ylabel='Hjorth Complexity', ax=axes[2])
plt.subplots_adjust(wspace=0.4)

ent_exp_corrs = bootstrap_corr(outputs['app_entropy'], outputs['specparam'])
print('  ENT & EXP:  ', format_corr(*ent_exp_corrs))
ent_lpz_corrs = bootstrap_corr(outputs['app_entropy'], outputs['lempelziv'])
print('  ENT & LPZ:  ', format_corr(*ent_lpz_corrs))
ent_hcx_corrs = bootstrap_corr(outputs['app_entropy'], outputs['hjorth_complexity'])
print('  ENT & HCX:  ', format_corr(*ent_hcx_corrs))
  ENT & EXP:   r=-0.886  CI[-0.898, -0.871],  p=0.000
  ENT & LPZ:   r=+0.869  CI[+0.855, +0.882],  p=0.000
  ENT & HCX:   r=-0.254  CI[-0.297, -0.210],  p=0.000
Compare LZ complexity to other measures
# Comparisons of LZ complexity to other measures
_, axes = plt.subplots(1, 3, figsize=(15, 4))
plot_dots(outputs['lempelziv'], outputs['specparam'], alpha=0.25,
          xlabel='LZ Complexity', ylabel='Aperiodic Exponent', ax=axes[0])
plot_dots(outputs['lempelziv'], outputs['app_entropy'], alpha=0.25,
          xlabel='LZ Complexity', ylabel='Entropy', ax=axes[1])
plot_dots(outputs['lempelziv'], outputs['hjorth_complexity'], alpha=0.25,
          xlabel='LZ Complexity', ylabel='Hjorth Complexity', ax=axes[2])
plt.subplots_adjust(wspace=0.4)

lpz_exp_corrs = bootstrap_corr(outputs['lempelziv'], outputs['specparam'])
print('  LPZ & EXP:  ', format_corr(*sp_ir_corrs))
lpz_ent_corrs = bootstrap_corr(outputs['lempelziv'], outputs['app_entropy'])
print('  LPZ & ENT:  ', format_corr(*sp_ir_corrs))
lpz_hcx_corrs = bootstrap_corr(outputs['lempelziv'], outputs['hjorth_complexity'])
print('  LPZ & HCX:  ', format_corr(*sp_ir_corrs))
  LPZ & EXP:   r=-0.943  CI[-0.950, -0.936],  p=0.000
  LPZ & ENT:   r=-0.943  CI[-0.950, -0.936],  p=0.000
  LPZ & HCX:   r=-0.943  CI[-0.950, -0.936],  p=0.000
Compare Hjorth complexity to other measures
# Comparisons of Hjorth complexity to other measures
_, axes = plt.subplots(1, 3, figsize=(15, 4))
plot_dots(outputs['hjorth_complexity'], outputs['specparam'], alpha=0.25,
          xlabel='Hjorth Complexity', ylabel='Aperiodic Exponent', ax=axes[0])
plot_dots(outputs['hjorth_complexity'], outputs['app_entropy'], alpha=0.25,
          xlabel='Hjorth Complexity', ylabel='Entropy', ax=axes[1])
plot_dots(outputs['hjorth_complexity'], outputs['lempelziv'], alpha=0.25,
          xlabel='Hjorth Complexity', ylabel='LZ Complexity', ax=axes[2])
plt.subplots_adjust(wspace=0.4)

sp_ir_corrs = bootstrap_corr(outputs['hjorth_complexity'], outputs['specparam'])
print('  SP & IR:  ', format_corr(*sp_ir_corrs))
sp_ir_corrs = bootstrap_corr(outputs['hjorth_complexity'], outputs['app_entropy'])
print('  SP & IR:  ', format_corr(*sp_ir_corrs))
sp_ir_corrs = bootstrap_corr(outputs['hjorth_complexity'], outputs['lempelziv'])
print('  SP & IR:  ', format_corr(*sp_ir_corrs))
  SP & IR:   r=+0.277  CI[+0.234, +0.320],  p=0.000
  SP & IR:   r=-0.254  CI[-0.298, -0.210],  p=0.000
  SP & IR:   r=-0.631  CI[-0.660, -0.600],  p=0.000
Conclusions
Words, words, words.