Exponent to Time Domain Comparisons
Contents
Exponent to Time Domain Comparisons
This notebook compares methods that estimat aperiodic exponent to time domain methods.
Compared methods:
spectral parameterization
hurst exponent
detrended fluctation analysis
Hjorth complexity
Lempel Ziv complexity
Higuchi Fractal Dimension
Sample Entropy
Permutation Entropy
Approximate Entropy
Spectral Entropy
import numpy as np
import matplotlib.pyplot as plt

from neurodsp.sim import sim_combined
from neurodsp.utils import set_random_seed

from bootstrap import bootstrap_corr
# Import custom code
import sys; from pathlib import Path
sys.path.append(str(Path('..').resolve()))

from apm.run import run_comparisons
from apm.plts import plot_dots
from apm.utils import format_corr, sampler

from apm.methods import specparam, hurst, dfa, higuchi_fd
from apm.methods import hjorth_activity, hjorth_mobility, hjorth_complexity, lempelziv
from apm.methods import sample_entropy, perm_entropy, app_entropy, spectral_entropy
from apm.methods.settings import HURST_PARAMS, DFA_PARAMS
from apm.methods.settings import AP_ENT_PARAMS, SA_ENT_PARAMS, PE_ENT_PARAMS, SP_ENT_PARAMS

from apm.sim.settings import FS, SIM_PARAMS_COMB
Settings
# Define settings
f_range = [1, 50]
specparam_kwargs = {'min_peak_height' : 0.05, 'fs' : FS, 'f_range' : f_range}
# Set the random seed
set_random_seed(111)
# Notebook settings
SAVE_FIG = False
Collect Methods
# Define ranges to sample parameters from
samplers = {'update_comb_exp' : sampler(np.arange(-2.5, 0.1, 0.1)),
            'update_pow' : sampler(np.arange(0, 1, 0.1)),
            'update_freq' : sampler(np.arange(5, 35, 1))}
# Define measures to apply
measures = {specparam : specparam_kwargs,
            hurst : HURST_PARAMS,
            dfa : DFA_PARAMS,
            hjorth_complexity : {},
            lempelziv : {},
            higuchi_fd : {},
            app_entropy : AP_ENT_PARAMS,
            perm_entropy : PE_ENT_PARAMS,
            sample_entropy : SA_ENT_PARAMS,
            spectral_entropy : SP_ENT_PARAMS}
Run Simulations
N_SIMS = 1000
# Run simulations
outputs = run_comparisons(sim_combined, SIM_PARAMS_COMB, measures, samplers, n_sims=N_SIMS)
/Users/tom/opt/anaconda3/lib/python3.8/site-packages/antropy/entropy.py:249: RuntimeWarning: divide by zero encountered in log2
se = -(psd_norm * np.log2(psd_norm)).sum(axis=axis)
/Users/tom/opt/anaconda3/lib/python3.8/site-packages/antropy/entropy.py:249: RuntimeWarning: invalid value encountered in multiply
se = -(psd_norm * np.log2(psd_norm)).sum(axis=axis)
Exponent to Fluctuations
# Plot comparisons
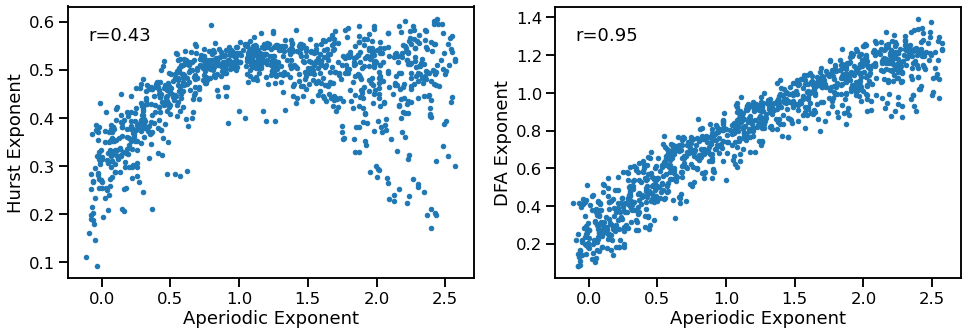
_, axes = plt.subplots(1, 2, figsize=[16, 5])
plot_dots(outputs['specparam'], outputs['hurst'], tposition='tl',
          xlabel='Aperiodic Exponent', ylabel='Hurst Exponent', ax=axes[0])
plot_dots(outputs['specparam'], outputs['dfa'], tposition='tl',
          xlabel='Aperiodic Exponent', ylabel='DFA Exponent', ax=axes[1])

# Compute bootstrapped correlations
corrs_hst = bootstrap_corr(outputs['specparam'], outputs['hurst'])
corrs_dfa = bootstrap_corr(outputs['specparam'], outputs['dfa'])
print('Correlations:')
print('  EXP & HST:  ', format_corr(*corrs_hst))
print('  EXP & DFA:  ', format_corr(*corrs_dfa))
Correlations:
  EXP & HST:   r=+0.435  CI[+0.371, +0.499],  p=0.000
  EXP & DFA:   r=+0.951  CI[+0.943, +0.957],  p=0.000
Exponent to Complexity
# Plot comparisons
_, axes = plt.subplots(1, 3, figsize=[20, 5])
plot_dots(outputs['specparam'], outputs['hjorth_complexity'], tposition='tl',
          xlabel='Aperiodic Exponent', ylabel='Hjorth Complexity', ax=axes[0])
plot_dots(outputs['specparam'], outputs['lempelziv'],
          xlabel='Aperiodic Exponent', ylabel='LZ Complexity', ax=axes[1])
plot_dots(outputs['specparam'], outputs['higuchi_fd'],
          xlabel='Aperiodic Exponent', ylabel='Higuchi FD', ax=axes[2])
plt.subplots_adjust(wspace=0.4)

# Compute bootstrapped correlations
corrs_hjo = bootstrap_corr(outputs['specparam'], outputs['hjorth_complexity'])
corrs_lzc = bootstrap_corr(outputs['specparam'], outputs['lempelziv'])
corrs_hfd = bootstrap_corr(outputs['specparam'], outputs['higuchi_fd'])
print('Correlations:')
print('  EXP & HJO:  ', format_corr(*corrs_hjo))
print('  EXP & LZC:  ', format_corr(*corrs_lzc))
print('  EXP & HFD:  ', format_corr(*corrs_hfd))
Correlations:
  EXP & HJO:   r=+0.910  CI[+0.889, +0.927],  p=0.000
  EXP & LZC:   r=-0.962  CI[-0.967, -0.955],  p=0.000
  EXP & HFD:   r=-0.957  CI[-0.961, -0.952],  p=0.000
Exponent to Entropy
# Plot comparisons
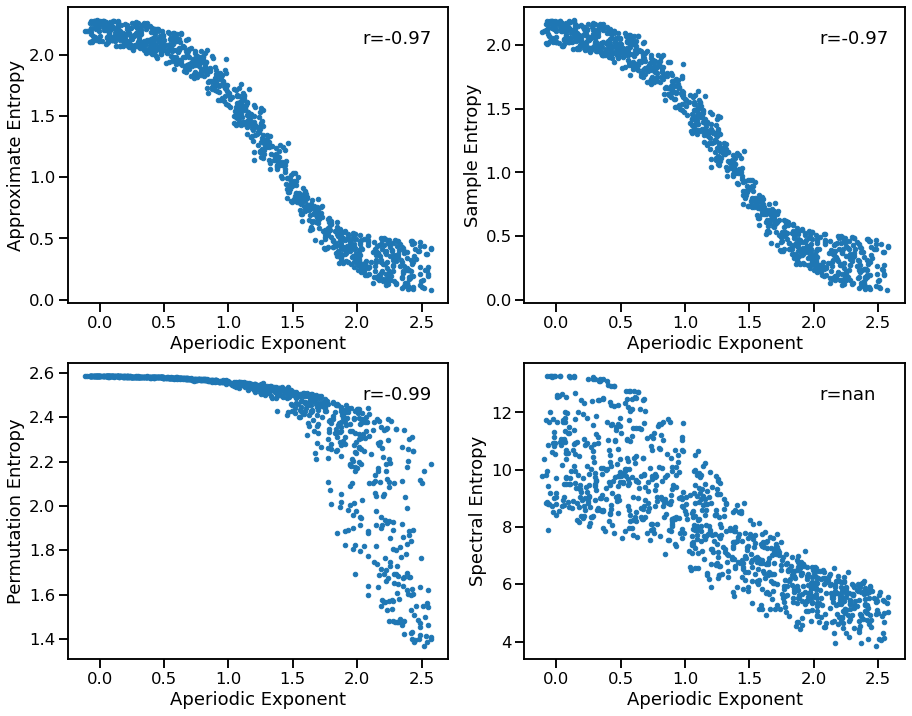
_, axes = plt.subplots(2, 2, figsize=[15, 12])
plot_dots(outputs['specparam'], outputs['app_entropy'],
          xlabel='Aperiodic Exponent', ylabel='Approximate Entropy', ax=axes[0, 0])
plot_dots(outputs['specparam'], outputs['perm_entropy'],
          xlabel='Aperiodic Exponent', ylabel='Permutation Entropy', ax=axes[1, 0])
plot_dots(outputs['specparam'], outputs['sample_entropy'],
          xlabel='Aperiodic Exponent', ylabel='Sample Entropy', ax=axes[0, 1])
plot_dots(outputs['specparam'], outputs['spectral_entropy'],
          xlabel='Aperiodic Exponent', ylabel='Spectral Entropy', ax=axes[1, 1])

# Compute bootstrapped correlations
corrs_appr = bootstrap_corr(outputs['specparam'], outputs['app_entropy'])
corrs_perm = bootstrap_corr(outputs['specparam'], outputs['perm_entropy'])
corrs_samp = bootstrap_corr(outputs['specparam'], outputs['sample_entropy'])
corrs_spct = bootstrap_corr(outputs['specparam'], outputs['spectral_entropy'])
print('Correlations:')
print('  EXP & APPR:  ', format_corr(*corrs_appr))
print('  EXP & PERM:  ', format_corr(*corrs_perm))
print('  EXP & SAMP:  ', format_corr(*corrs_samp))
print('  EXP & SPCT:  ', format_corr(*corrs_spct))
Correlations:
  EXP & APPR:   r=-0.974  CI[-0.977, -0.969],  p=0.000
  EXP & PERM:   r=-0.986  CI[-0.989, -0.983],  p=0.000
  EXP & SAMP:   r=-0.973  CI[-0.977, -0.968],  p=0.000
  EXP & SPCT:   r=+nan  CI[+nan, +nan],  p=nan
Conclusions
Comparing between these methods, overall we can see that:
Hurst and DFA exponent generally increase with increasing aperiodic exponent
Hjorth complexity increases, but lempel-ziv and higuchi fractal dimension decrease, with increasing exponent
Entropy measures generally decrease with increasing exponent