AutoCorrelation
Contents
AutoCorrelation
This notebook examines auto-correlation measures applied to simulated neural time series.
import numpy as np
import matplotlib.pyplot as plt

from neurodsp.aperiodic import compute_autocorr
from neurodsp.sim import sim_powerlaw, sim_combined, sim_synaptic_current
# Import custom code
import sys; from pathlib import Path
sys.path.append(str(Path('..').resolve()))

from apm.run import run_sims
from apm.methods import autocorr
from apm.methods.settings import AC_PARAMS
from apm.plts import plot_lines, plot_colorbar
from apm.plts.utils import truncate_colormap
from apm.sim.settings import FS, SIM_PARAMS_AP, SIM_PARAMS_COMB, EXPS, FREQS, POWERS, N_SIMS
from apm.sim.examples import SIG_AP, SIG_KN, SIG_OSC, SIG_COMB
Settings
# Custom settings
#   Downsample frequencies and powers
FREQS = np.arange(5, 40, 10)
POWERS = np.arange(0, 2.5, 0.5)
# Check auto-correlation parameters
AC_PARAMS
{'max_lag': 250, 'lag_step': 1}
# Set the colormap for the plots
cmap_name = 'BuGn_r'
cmap_range = (0., 0.75)

# Get the requested colormap & range
cmap = truncate_colormap(plt.get_cmap(cmap_name), *cmap_range)

# Set up the colors for plotting
exp_colors = cmap(np.linspace(0., 1.0, len(EXPS)))
freq_colors = cmap(np.linspace(0., 1.0, len(FREQS)))
power_colors = cmap(np.linspace(0., 1.0, len(POWERS)))
# Notebook settings
SAVE_FIG = False
Calculating AutoCorrelation on Example Signals
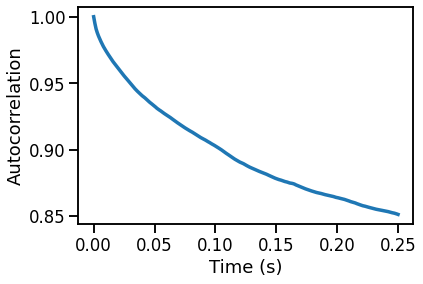
Powerlaw Signals
# Calculate autocorrelation
times, sig_acs = compute_autocorr(SIG_AP, **AC_PARAMS)
# Plot the autocorrelation across time delays
plot_lines(times / FS, sig_acs)
plot_lines(xlabel='Time (s)', ylabel='Autocorrelation')
Oscillatory Signal
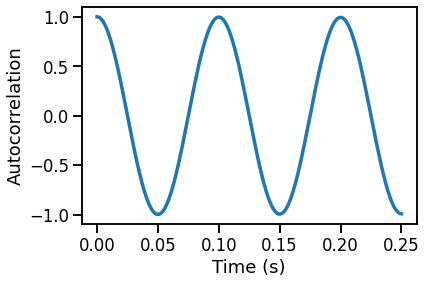
# Calculate autocorrelation
times, sig_osc = compute_autocorr(SIG_OSC, **AC_PARAMS)
# Plot the autocorrelation across time delays
plot_lines(times / FS, sig_osc)
plot_lines(xlabel='Time (s)', ylabel='Autocorrelation')
Combined Signal
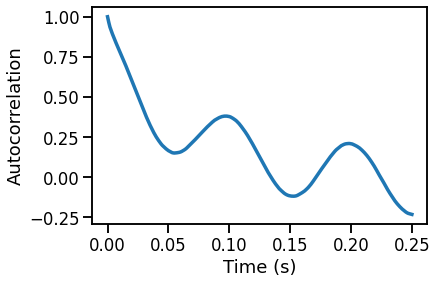
# Calculate autocorrelation
times, sig_comb = compute_autocorr(SIG_COMB, **AC_PARAMS)
# Plot the autocorrelation across time delays
plot_lines(times / FS, sig_comb)
plot_lines(xlabel='Time (s)', ylabel='Autocorrelation')
Powerlaw Signals with a Knee
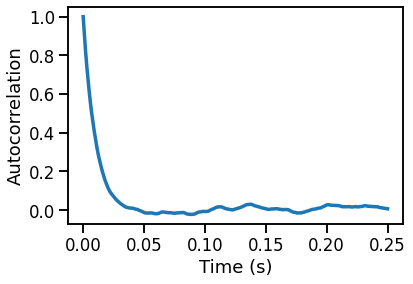
# Calculate autocorrelation
times, sig_acs = compute_autocorr(SIG_KN, **AC_PARAMS)
# Plot the autocorrelation across time delays
plot_lines(times / FS, sig_acs)
plot_lines(xlabel='Time (s)', ylabel='Autocorrelation')
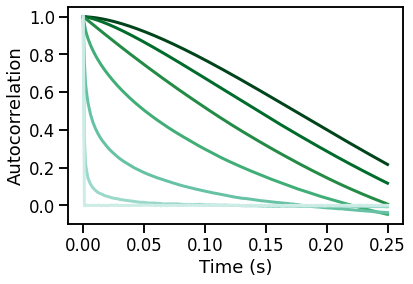
AutoCorrelation Simulations: Aperiodic Variations
Powerlaw Signals
# Run a set of simulations, calculating autocorrelation across exponents
acs_pow = run_sims(sim_powerlaw, SIM_PARAMS_AP, autocorr, AC_PARAMS,
                   'update_exp', EXPS, N_SIMS)
acs_pow = np.array(acs_pow)
# Plot autocorrelation across exponent values
for ac, color in zip(acs_pow, exp_colors):
    plot_lines(times / FS, ac, color=color, lw=3)
plot_lines(xlabel='Time (s)', ylabel='Autocorrelation')
plot_lines(save_fig=SAVE_FIG, file_name='acs_exp', file_path='autocorr')
Combined Signals
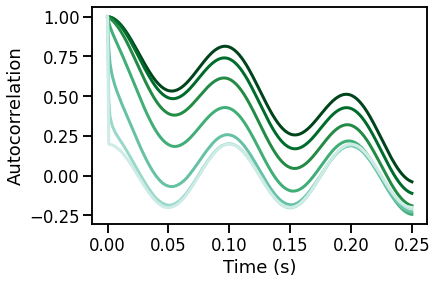
# Run a set of simulations, calculating autocorrelation across exponents, with an oscillation
acs_osc = run_sims(sim_combined, SIM_PARAMS_COMB, autocorr, AC_PARAMS,
                   'update_comb_exp', EXPS, N_SIMS)
acs_osc = np.array(acs_osc)
# Plot autocorrelation across exponent values
for ac, color in zip(acs_osc, exp_colors):
    plot_lines(times / FS, ac, color=color, lw=3)
plot_lines(xlabel='Time (s)', ylabel='Autocorrelation')
plot_lines(save_fig=SAVE_FIG, file_name='acs_comb', file_path='autocorr')
AutoCorrelation Simulations: Periodic Variations
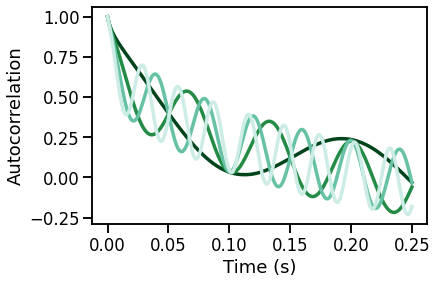
Oscillation Frequency
# Run a set of simulations, calculating autocorrelations across oscillation frequency
sims_freq = run_sims(sim_combined, SIM_PARAMS_COMB, autocorr, AC_PARAMS,
                     'update_freq', FREQS, N_SIMS)
# Plot autocorrelation across oscillation frequency
for ac, color in zip(sims_freq, freq_colors):
    plot_lines(times / FS, ac, color=color)
plot_lines(xlabel='Time (s)', ylabel='Autocorrelation')
plot_lines(save_fig=SAVE_FIG, file_name='acs_osc_freq', file_path='autocorr')
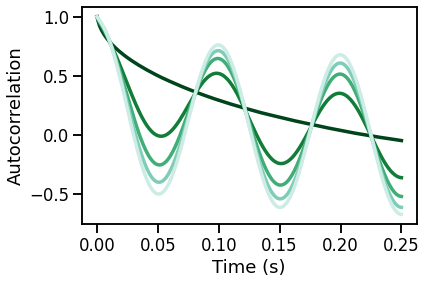
Oscillation Power
# Run a set of simulations, calculating autocorrelations across oscillation power
sims_pow = run_sims(sim_combined, SIM_PARAMS_COMB, autocorr, AC_PARAMS,
                    'update_pow', POWERS, N_SIMS)
# Plot autocorrelation across oscillation power
for ac, color in zip(sims_pow, power_colors):
    plot_lines(times / FS, ac, color=color)
plot_lines(xlabel='Time (s)', ylabel='Autocorrelation')
plot_lines(save_fig=SAVE_FIG, file_name='acs_osc_pow', file_path='autocorr')
Create colorbars for the plots
# Make colorbars for the plots
plot_colorbar(cmap, min(EXPS), max(EXPS), 'exponent', close=True,
              save_fig=SAVE_FIG, file_name='acs_exp_cbar', file_path='autocorr')

# Make colorbars for the plots
plot_colorbar(cmap, min(FREQS), max(FREQS), 'frequency', close=True,
              save_fig=SAVE_FIG, file_name='acs_freq_cbar', file_path='autocorr')

# Make colorbars for the plots
plot_colorbar(cmap, min(POWERS), max(POWERS), 'power', close=True,
              save_fig=SAVE_FIG, file_name='acs_pow_cbar', file_path='autocorr')
Conclusions
Overall, we can see the following patterns in these simulations:
Autocorrelation:
The autocorrelation of 1/f signals decreases across increasing time lags
The quickness of this decay relates to the 1/f exponent
The autocorrelation of periodic signals is itself rhythmic
The frequency and scale of the autocorrelation relates to oscillatory frequency and power respectively
The autocorrelation of combined signals exhibits with decreasing + rhythmic properties of each component